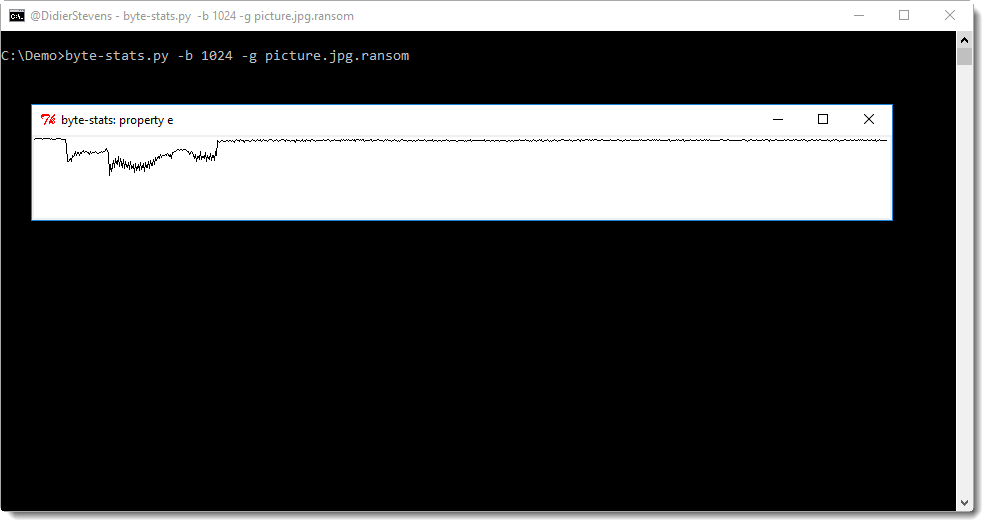
My tool byte-stats.py calculates statistics for the files it analyzes. With option -l (and -p) , it produces a list of values for different parts of the file (buckets), for example a list of entropy values. With this, one can have an idea how the entropy changes inside a file.
But as the saying goes, a picture is worth a thousand words, so I added option -g to produce a very simple graph of these values (just a line, no axis or scale). This does not require any extra Python module, I use Python’s TkInter module, the standard GUI for Python.
byte-stats_V0_0_7.zip (https)
MD5: 9991B5C5BEB3CB7989FE6DC30789EB49
SHA256: 82198195EA9C92832027CC8E2E3ABE161787551A06750E042096CF2DF0AC9384

[…] Update: byte-stats.py Version 0.0.7 […]
Pingback by Week 44 – 2017 – This Week In 4n6 — Sunday 5 November 2017 @ 9:01
[…] Update: byte-stats.py Version 0.0.7 […]
Pingback by Overview of Content Published In November | Didier Stevens — Wednesday 6 December 2017 @ 0:00
[…] I could use my translate program to select every 4th byte (position % 4 == 3) and then calculate byte statistics. But actually, translate.py can use a (complex) Python expression/program to translate each byte of […]
Pingback by Update: translate.py Version 2.5.3 | Didier Stevens — Sunday 18 February 2018 @ 0:00