If you installed GNU Radio and want to know how to create the Flow Graph I used to test my SDR, follow along:
Start GNU Radio Companion, and create a new WX GUI file:

You will see 2 blocks, Options and Variable:
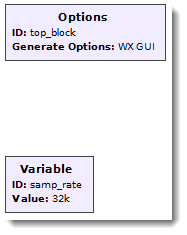
Notice that the ID is “top_block” (that’s the default), and that the Generate Options is “WX GUI” (QT GUI is the default).
Variable is a block that defines a variable for the sample rate: samp_rate. By default, it’s 32k (32000), but that’s too small.
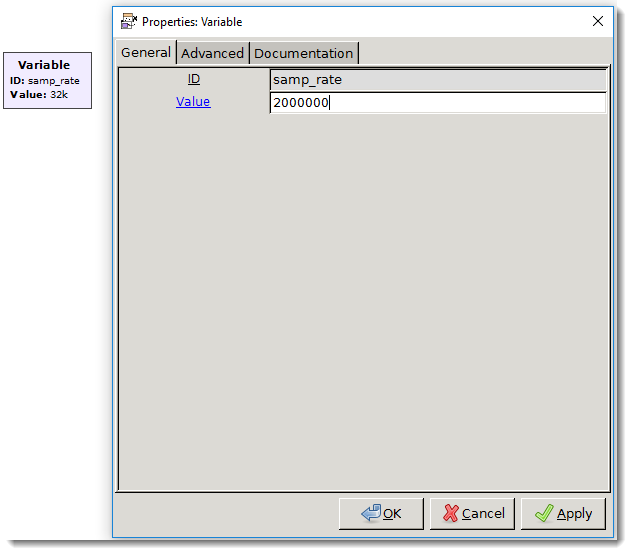
For my RTL-SDR, I will use 2 MHz (2000000 Hz). Double click the Variable block, change the value and click OK:
Now we will add a block that represents our SDR as a source of data. Go to the right menu and select “RTL-SDR Source” (you can click the search button on the toolbar to search for this block).

Drag this block into the flow graph:

Notice that the title of this block is in red: that’s to indicate that there is an error with this block (it’s not connected). We will fix that soon.
Next select the “WX GUI Waterfall Sink” block:

Drag this block into the flow graph:
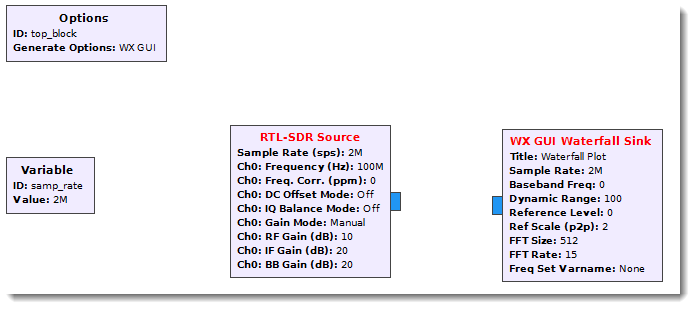
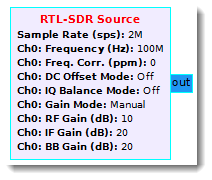
Hover with your mouse over the blue port of block “RTL-SDR Source”, the word “out” will appear:

Click on the blue port:
Now hover with your mouse over the blue port of block “WX GUI Waterfall Sink”, the word “in” will appear:

Click on the blue port:
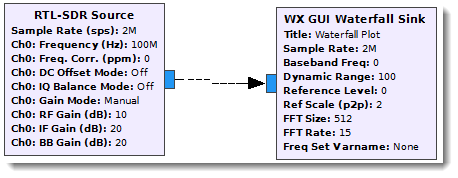
An arrow connects the 2 ports, and the titles turn black (no errors).
The default frequency of block “RTL-SDR Source” is 100 MHz. I will tune this to a local FM radio station at 100.6 MHz. Double click the “RTL-SDR Source” block, and edit the Ch0 Frequency: 100.6e6 is 100600000 or 100.6 MHz (e6 is the exponent notation for 1000000, 6 zeroes).

We can now save the flow graph. A flow graph has to be saved before it can be executed, if it is not saved, GNU Radio Companion will display a save dialog box when you execute the flow graph.

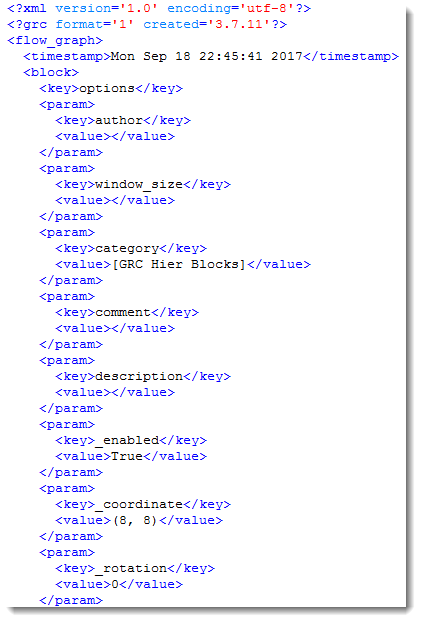
The extension for flow graph files is .grc:

A .grc file is an XML file:
Now we can execute the flow graph by clicking on the Play button:

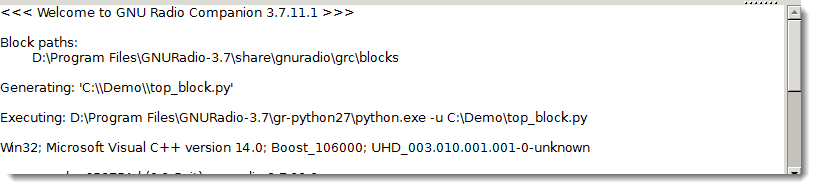
When everything works fine, you should see output like this:

The green bands represent the signals of broadcast stations, and in the terminal you can see that a top_block.py program was generated and executed, and that GNU Radio is able to connect to the SDR device and get data.
GNU Radio Companion creates the top_block.py program (the name comes from the ID in the Options block), and executes it with GNU Radio:

If GNU Radio is not able to get data from your SDR device, it will generate null values: the waterfall plot will be uniform blue, and the terminal will report errors:

You can stop the Python program from running by clicking the stop button:

If there are errors in your flow graph, you will not be able to click the play button. Click the error button to get more info:


[…] Quickpost: Creating A Simple Flow Graph With GNU Radio Companion […]
Pingback by Overview of Content Published In September | Didier Stevens — Sunday 15 October 2017 @ 16:10
[…] The main view of GNU Radio Companion (GRS) is the flow graph […]
Pingback by An Interview with Derek Kozel | The Amp Hour Electronics Podcast — Monday 26 February 2018 @ 3:54
[…] Creating a flow graph […]
Pingback by IoT Pentesting - Useful resource - Pentest_p4nther — Monday 29 July 2019 @ 20:02
[…] Creating a flow graph […]
Pingback by IoT Pentesting – Approach & Methods – syhack — Monday 23 September 2019 @ 8:36